BEPUphysics v1.2.0 includes some improvements to multithreaded scaling, particularly in the DynamicHierarchy broad phase with certain core counts. Given that I recently/finally upgraded my CPU, it seemed appropriate to investigate scaling in the presence of hyperthreading.
3770K
[Before continuing, note that all multithreading comparisons in this article are slightly biased towards the single threaded case. Single threaded cases can bypass the overhead of dispatching work entirely, so the jump from one to two threads isn't entirely apples to apples...
...And I may have forgotten to turn off turbo boost in certain tests using the 3770K; oops. Fortunately, the base clock is 4.5ghz and the boosted frequency is 4.6ghz, so the difference should be no more than 2% or so on the 1 core and sometimes 2 core cases.]
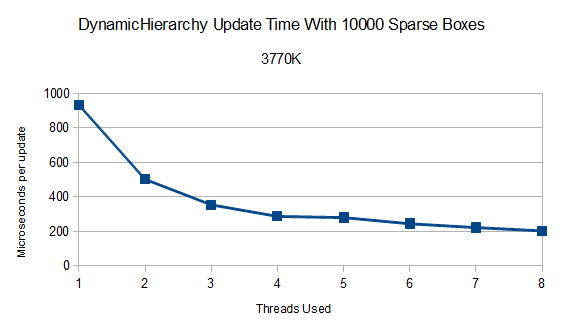
Given the improvements, it seems natural to start with the broad phase. This test uniformly distributes thousands of boxes in a volume and then runs broad phase updates many thousands of times for different thread counts. This is running on the quad core hyperthreaded 3770K.

That's almost five times faster on a processor with four physical cores. A decent improvement over the old results in v0.16.0 on my Q6600!
After four threads, the gains slow down as expected. However, using all 8 available threads still manages to be 41% faster than 4 threads.
How about the running the same test on the 3770K with hyperthreading disabled?

It's roughly equivalent with the first four hyperthreaded results, within error imposed by differing process environments. That's good; the thread scheduling is handled effectively by Windows 7 when hyperthreading is enabled. The final non-hyperthreading speedup is around 3.5 times. Not bad for 4 threads, but not as good as hyperthreading.
Now for some full simulations! The following test measures a few hundred/thousand time steps of three different configurations. The full time for each simulation in milliseconds is recorded.
The first simulation is 5000 boxes falling out of the sky onto a pile of objects. This starts out primarily stressing the broad phase before the pile-up begins. Then, as the pile grows and thousands of collision pairs are created, it stresses some bookkeeping code's potential sequential bottlenecks, the narrow phase, and the solver. It runs for 700 time steps.
The second simulation is a big wall built of 4000 boxes. This mostly stresses the solver, with narrow phase second and broad phase third. It runs for 800 time steps.
The final simulation is 15625 boxes orbiting a planet (like the PlanetDemo) for 3000 time steps.
All of the simulations can run in real time, but the tests simulate the time steps as fast as they can calculate without any frame delays.
First, with hyperthreading:

Somewhat surprisingly, they all scale similarly. I was expecting the solver-heavy simulations to suffer a bit due to the added contention. Something is stopping the scaling from doing quite as well as the broad phase alone, though; the scaling ranges from 3.5 (Planet) to 3.8 (Pile). The Planet scaling being lower is quite interesting since a large portion of that simulation should be the high-scaling broad phase.
Without hyperthreading:

The scalings range from 2.91 to 3.08 times faster at 4 threads. That's about the same as the 4 threads in hyperthreading. Once again, the Pile has the best scaling and the Planet the worst scaling for currently unknown reasons.
The consistency in scaling between different simulations is promising; it is evidence that there aren't any huge potholes in simulation type to watch out for when going for maximum performance.
Xbox360
We'll start with DynamicHierarchy tests again for the Xbox360. If I remember correctly, these results were on a smaller set of objects than was run on the 3770K (since a 3770K core is far faster than an Xbox360 core).

Not quite as impressive as the 3770K's scaling, but it still gets to around twice as fast. The important thing to note here is the speed boost offered by the usage of that final hardware thread. (The Xbox360 only has 3 physical cores with 6 hardware threads distributed between them. Two hardware threads, one on each of the first two physical cores, are reserved and cannot be used from within XNA projects.)
Despite theoretically stressing the load balancer more, loading up that last physical core with both hardware threads appears to be a win.
How about the full simulations? (Note that these were reduced in size a bit because the Xbox360 had a habit of getting too hot and trying to take a nap after thousands of reruns.)

Once again not quite as great as the 3770K's scaling. However, the Wall manages a respectable 2.3 times faster, providing more evidence that the parallel solver scales better than expected.
The Pile reverses its performance on the 3770K and shows a case where throwing as many threads as possible at a problem isn't the best option in all cases. It's within error (taking a little less than 4% longer to complete), but it's obviously not a clear victory. This suggests it's worth testing both 3 and 4 threads to see what behaves better for your simulation.
3930K
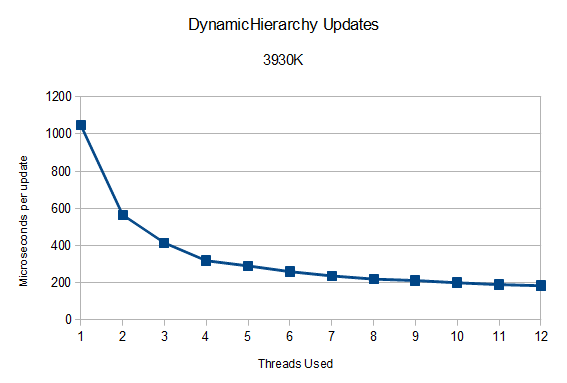
To the next platform: a 3930K running at 4.3ghz! Once again, we'll start with the DynamicHierarchy test. This is the same test that ran on the 3770K.

While we don't see scaling higher than the physical core count this time, it still gets to a decent 5.75 times faster. Interestingly, the single threaded time falls right in line with expectations relative to the 3770K; it takes 7% longer due to the 300 mhz speed difference, and another 5% or so due to the architecture improvements in Ivy Bridge over Sandy Bridge E.
Part of the difficulty here in getting the same kind of usage as 8 cores did on the 3770K may be the binary form of the dynamic hierarchy. It naturally runs better on systems with core counts that are a power of two. v1.2.0 tries to compensate for this, but it can only help so much before single threaded bottlenecking eliminates any threading gains. Does anyone out there have an 8 core hyperthreaded Xeon or dual processor setup to test this theory? :)
Now for the most interesting test:

What is going on here? The solver-heavy Wall once again is the unexpected bastion of stable and robust scaling, reaching 4.2 times faster. It doesn't benefit from the final two threads, though. The other two simulations seem to have a seizure after 8 threads.
When I first saw these numbers, I assumed there had to be some environmental cause, but I couldn't locate any. Unfortunately, since the 3930K is not mine, I was unable to spend a long time searching. Hopefully I'll get some more testing time soon.
Wrap Up
Try using all the available threads. It seems to help most of the time. If the platform a has a huge number of cores, tread carefully, test, and tell me how it looks!
I don't have access to any recent AMD processors, so if any of you Bulldozers/soon-to-be-Piledrivers want to give these tests a shot, it could be informative. The tests used to generate the data in this post are in the BEPUphysicsDemos (MultithreadedScalingTestDemo and BroadPhaseMultithreadingTestDemo).
I still suspect some type of shenanigans on the 3930K simulations test, but the evidence has shown there are some aspects of threading behavior in BEPUphysics that I did not model properly. The solver seems to be a consistently good scaler. The question then becomes, if the DynamicHierarchy and Solver both scale well, what else in the largely embarrassingly-parallel loopfest of the engine is keeping things from scaling higher?
The answer to that will have to wait for more investigation and another post, to be completed hopefully before hexacores, octocores, and beyond are all over the place!
Questions or comments? Head to the forums!
